Business Review
DELIVERING PROGRESSIVE RETURNS
In 2014, PHP continued to deliver on its overarching strategic aim of delivering progressive returns to shareholders. It has met its operating objectives of:
- acquiring modern healthcare premises
- investing in its existing property assets to generate additional income and enhance value
- managing operating costs to make the Group more efficient
- securing capital resource to provide a strong longer term base from which to invest, whilst ensuring that the average cost of debt is effectively managed.
We have achieved our objective of increasing earnings and as a result dividend cover. This was whilst paying a modestly increased dividend, but on a much larger number of shares in issue compared to that of 2013.
Earnings
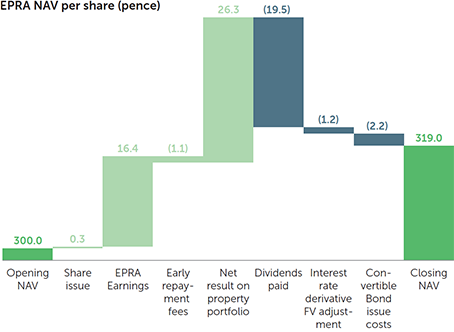
The Group’s earnings were significantly increased by the impact of the transactions completed in late 2013 and through 2014. The PPP portfolio produced a total of £14.8 million of rental income in the year, helping to increase rents received by 42.5% to £59.3 million (2013: £41.6 million). Reductions in advisory and management fee rates and the average cost of the Group’s debt finance further improved earnings performance. Group profit before tax rose by 82.7% to £36.9 million (2013: £20.2 million).
Total dividends paid in the year increased by 2.6% to 19.5 pence per share (2013: 19.0 pence), but the increase in Group earnings saw dividend cover rise to 84%. This is a significant increase over that of 2013, of 57%, and a significant step forward towards reaching 100% cover.
Summarised results
|
2014 £m |
2013 £m |
|
|
Net rental income |
59.3 |
41.6 |
|
Administrative expenses |
(6.8) |
(6.1) |
|
Operating profit before revaluation gain and financing |
52.5 |
35.5 |
|
Net financing costs |
(34.3) |
(26.0) |
|
Non-recurring operating costs1 |
- |
(2.7) |
|
EPRA earnings |
18.2 |
6.8 |
|
Net result on property portfolio |
29.2 |
2.3 |
|
Profit on sale of finance lease |
- |
0.6 |
|
Early loan repayment fee |
(1.2) |
(0.9) |
|
Fair value (loss)/gain on interest rate derivatives |
(2.4) |
11.4 |
|
Fair value loss on convertible bond |
(4.5) |
- |
|
Non-recurring: convertible bond issue costs1 |
(2.4) |
- |
|
IFRS profit before tax |
36.9 |
20.2 |
|
EPRA earnings per share |
16.4p |
7.6p |
(1) JOHCM contractural termination fee
Shareholder Value
The characteristics of the Group’s property portfolio with its longevity and security of income have made healthcare real estate more attractive to real estate investors, particularly those looking for consistent yield. The revaluation of the Group’s property portfolio at 31 December 2014 produced a net surplus of £29.2 million.
As is required by accounting standards, the total issue costs of the convertible bond issued in the year, £2.45 million, have been fully expensed and the Group incurred other early repayment charges related to the refinance of the PPP debt of £1.2 million.
The net effect of the above has been an overall increase in EPRA Net Asset Value per share of 19.0 pence. Including the dividend paid in 2014, Total NAV Return for the period was 38.5 pence per share or 12.8% (2013: 4.6%).
GROW PROPERTY PORTFOLIO
As at 31 December 2014, the Group held a total of 265 property assets, with 260 completed and five on-site, under construction. The entire portfolio was independently valued by Lambert Smith Hampton (“LSH”), at market value in accordance with RICS rules. This totalled £1.04 billion including commitments, generating a surplus of £29.2 million, after the effect of the total costs of assets purchased and asset management projects undertaken in the period. This surplus, equivalent to 26.3 pence per share, is an increase of 8.8% on opening EPRA NAV per share of 300 pence per share at the start of 2014.
Portfolio valuation and performance
|
2014 £m |
2013 £m |
|
|
Investment properties |
1,002.4 |
929.9 |
|
Properties in the course of development |
23.9 |
11.7 |
|
Total properties at |
1,026.3 |
941.6 |
|
Cost to complete development commitments |
11.2 |
17.1 |
|
Total completed and committed |
1,037.5 |
958.7 |
Yields in the property sector in general have tightened considerably through 2014. Prime real estate markets have seen heightened investor appetite as confidence has returned with the improved performance of the UK economy and the emergence of rental growth in some sectors. Institutional investors have also looked more closely at alternative real estate classes and we have seen increased competition for assets that have longer lease terms with fixed or index linked rent review terms, particularly those that are larger lot sizes.
With the underlying characteristics of our sector and our largest income source, the NHS (directly or indirectly), being unchanged, a movement in yields in the primary care real estate sector has occurred but has been less pronounced than for commercial propery generally. This underpins the attractiveness of the sector with PHPs portfolio reflecting an average net initial yield of 5.52% (2013: 5.65%) and a true equivalent yield of 5.75% (2013: 5.92%).
The table below shows the total property return for periods ended 31 December 2014. TPR represents the sum of net rental income and valuation movement for the respective periods.
|
One year |
Three years |
Five years |
|
|
Primary Health Properties |
8.9% |
7.1% |
8.3% |
|
IPD All Property Index |
18.6% |
7.3% |
8.0% |
As in prior years, IPD will also prepare a Healthcare Property Index enabling a more bespoke benchmarking of PHP’s performance to its direct peers. This will again be published in February/early March 2015 and we will report our relative performance with our interim statement.
Following an exceptional period of activity in 2013, the Group added seven properties to its portfolio in the year, comprising three standing let investments and four development assets. These added £2.4 million of additional rent and an average of 24 years of unexpired lease term.
|
Asset |
Acquisition |
Acquisition cost |
Size |
WAULT at acquisition/on completion |
|
Pharmacy unit, Albany Surgery, Newton Abbot |
Completed investment |
£1.6 million |
753 sqm |
18 years |
|
Hume Street Medical Centre, Kidderminster |
Completed investment |
£11.0 million |
2,387 sqm |
28 years |
|
South Petherton Medical Centre, Somerset |
Completed investment |
£2.6 million |
916 sqm |
18 years |
|
The Fountains Health Centre, Chester |
Development asset |
£18.5 million |
5,754 sqm |
25 years |
|
Caia Park, Wrexham |
Development asset |
£2.2 million |
850 sqm |
20 years |
|
Hope Primary Care Resource Centre, |
Development asset |
£3.4 million |
1,793 sqm |
20 years |
|
Crown Medical Centre, Clipstone |
Development asset |
£3.7 million |
1,016 sqm |
25 years |
We took delivery of five previously contracted and let assets in the year, following completion of their construction by our development partners. We work closely with a number of specialist healthcare developers where our combined reputation, knowledge and experience of the sector plays a key role in securing new projects. We provide support to other developers who may be undertaking a primary care development for the first time or as part of a larger regeneration or development scheme.
In all instances, we work with our development partners, the GPs and the NHS who will be our longer term customers to ensure that we are delivering a property that meets their needs and provides flexibility for reconfiguration or expansion at any time in their occupation.
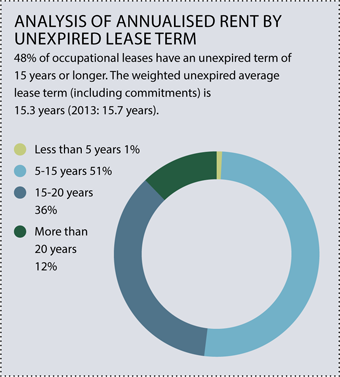
As at 31 December 2014, the Group’s contracted rent roll had increased by 5.7% to £60.9 million (31 December 2013: £57.6 million). More than 90% of rental income is funded directly or indirectly by the NHS and the portfolio has an average unexpired lease term of 15.3 years (2013: 15.7 years).
MANAGING EFFECTIVELY AND EFFICIENTLY
Once an asset is completed and rent producing, we implement our property and asset management strategies. These relate to both a high standard of ongoing maintenance and the longer term configuration and suitability of the premises in order that they continue to meet the needs of our tenants.
The Adviser, Nexus, is responsible for ensuring that PHP meets its obligations as Landlord at each of its assets. In addition, Nexus provides a service to tenants that offers advice and assistance where the tenant itself maintains a building. This includes regular meetings with our tenants in addition to a telephone helpdesk facility and online tools with repairs and maintenance advice.
Each occupational lease will include a periodic review of rental levels. 10% are performed annually, 76% on a three yearly basis and 13% being reviewed every five years. Most leases in the PHP portfolio have either explicit or effectively upwards only review terms (i.e. where the review is triggered by the landlord only). Just over a fifth, 23% of leases have fixed periodic rental uplifts or increases that are formally indexed linked, mostly in line with RPI. The most common review is undertaken to “open market”.
We have continued to secure satisfactory rental growth on review, with the weighted average uplift on 135 reviews completed in 2014 being 1.8% per annum. This is slightly reduced from that achieved in 2013 of 2.2% and reflects both the recent economic conditions and new centre approvals by the NHS which normally provide more immediate support for current rental levels. We expect to see rental growth at similar levels for the immediate future, but to increase as the rate of new development approvals increase.
We work closely with each of our tenants to ensure that over the longer term their property continues to be fit for purpose and offers the flexibility to be adapted and/or extended to meet the aspirations and changing demands put upon primary care providers.
This ensures that we retain our tenants and enables us to increase contracted rental income and lengthen occupational lease durations which add to both earnings and capital value. Projects take a number of forms that include:
- capital expenditure, ranging from small extensions to major construction projects; and
- managing existing leases through re-gearing or refurbishment and planned or specific maintenance programmes.
In 2014, PHP completed eight projects, investing a total of £4.4 million. These generated total additional rental income of £0.3 million, adding an average 15.7 additional years to the unexpired lease term and producing an aggregated 42% valuation gain on capital spent.
Two further projects are currently in progress, which will cost a total of £2.1 million. These will generate £0.2 million of additional rent for an average additional term of 20 years, a valuation surplus of 35% over the capital invested.
The Board continues to employ Nexus to source new investment opportunities and manage the Group’s property portfolio. Nexus receives a fee based on a proportion of the gross value of the Group’s property assets with the incremental rate reducing as the portfolio grows. Further reductions were made to fee rates with effect from May 2014 in anticipation of the portfolio exceeding £1 billion in value.
On 1 May 2014, Nexus assumed responsibility for the administration of the Group and provision of Company Secretarial services. Fees that had been paid to the previous administrator were contractually calculated as a proportion of gross property asset value, but Nexus receives a greatly reduced fixed annual fee that may be varied upwards or downwards in line with RPI.
The net impact of these changes was to lower the fees paid by the Group to its Advisers (Nexus and JOHCM1) to an average of 55 basis points of gross assets, a 22.5% reduction on 2013 when this average was 71 basis points. Including other overhead costs, the Group’s total expense ratio reduced to 69 basis points (2013: 88 basis points).
(1) JOHCM provided administrative and company secretarial services for periods to 30 April 2014.
DIVERSIFIED, LONG TERM FUNDING
The Board seeks to fund the Group with an appropriate combination of shareholder equity and external debt to enhance the returns that are generated. A key objective is to ensure that facilities continue to be available to the Group to enable continued growth, for a range of maturities at an appropriate blended cost and from a range of sources.
As part of the acquisition of the PPP portfolio in December 2013 the Group assumed £178 million of existing Aviva debt secured on those assets. It was the Board’s intention to refinance the debt and an allowance of £13.7 million toward the cost of this was made in the acquisition pricing. This debt was fully refinanced during 2014 by the completion of a number of transactions as set out below.
In February, the purchase provision was utilised to re-set the interest rate on the PPP Aviva allowance loans to 5.04% from the average upon purchase of 5.9%. This interest rate was applied from 1 January 2014. A capital repayment of £15 million was also made at this time, funded from the Group’s available headroom on existing facilities.
In April, a new £50 million, five year revolving debt facility was completed with HSBC Bank plc at an initial margin of 200 basis points over LIBOR. The first drawing from the HSBC facility upon its completion was used to repay £25 million of the outstanding PPP Aviva debt. A further £25 million of the PPP Aviva debt was repaid in April following the transfer of applicable collateral from Aviva to existing Group facilities.
The Group successfully issued an £82.5 million unsecured convertible bond on 20 May 2014, which it listed on the Channel Islands Stock Exchange. The unsecured bond is for a five year term with coupon of 4.25% per annum payable semi-annually. The initial conversion price applicable to the bond is 390 pence per share, a premium of 16% to the volume weighted share price on the day of pricing. The unsecured nature of this funding will increase the flexibility of the Group in structuring more traditional secured debt and allowed overall costs to be reduced as highlighted below.
The remaining £113 million of PPP debt was refinanced with Aviva in August with the creation of two facilities. These comprised a £50 million, 10 year interest only bullet repayment facility and a £63 million 15 year loan, interest only for five years with an element of amortisation from year six onwards and a further bullet repayment. Both loans carry a fixed interest rate of 4.91% for their duration, further reducing the interest cost to the Group.
Two further amendments to the Group’s debt portfolio were completed in August 2014:
- the loan with Barclays Bank PLC was increased by £30 million to an overall £100 million facility, consisting of a £40 million term loan and a £60 million revolving facility. This was agreed for a new five year term and the interest margin reduced from 220 basis points to an initial 170 basis points, and
- the Group’s £165 million Club facility with Royal Bank of Scotland and Santander was re-advanced for a new three year term, an additional 18 months on the original term. PHP used an element of the proceeds from the convertible bond, to lower the LTV within this facility and secure a reduction in the lending margin for this debt by 65 basis points to 185 basis points.
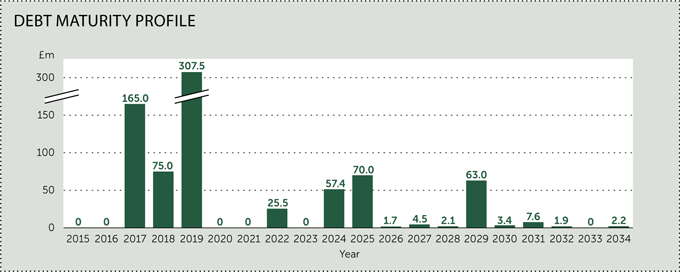
The principal value of debt drawn as at 31 December 2014 totalled £670.1 million. After Group cash balances of £12.0 million, Group net debt stood at £658.1 million. Allowing for funding the cost to complete development commitments at the year end of £11.2 million, headroom on existing facilities of £116.7 million was available to the Group (2013: £67.2 million).
Group loan to value (“LTV”) was 64.1% (31 December 2013: 61.6%) with interest cover for the year being 1.73 times (2013: 1.60 times). Certain debt facilities include a covenant requiring Group interest cover not to be less than 1.3 times, which has been met throughout 2014.
The average maturity of the Group’s debt facilities as at 31 December 2013, excluding the PPP loans was 5.8 years. The transactions set out above have increased the weighted average facility maturity to 6.2 years at the balance sheet date.
Unsecured debt facilities now represents 24% of the Group’s debt portfolio. Total debt comprises a mix of fixed and variable rate facilities and in order to mitigate the risk of increases in market interest rates, the Group holds a portfolio of interest rate derivative contracts (see Note 18 for details).
An analysis of the Group’s exposure to interest rate risk is as follows:
|
Facilities £m |
Facilities % |
Drawn £m |
Drawn % |
|
|
Fixed rate debt |
395.9 |
50.4 |
395.9 |
59.1 |
|
Debt hedged by interest rate swaps/caps |
221.0 |
28.1 |
221.0 |
33.0 |
|
Floating rate debt |
169.0 |
21.5 |
53.2 |
7.9 |
|
Total |
785.9 |
100.0 |
670.1 |
100.0 |